
What's new in Tally
May 17 – May 27, 2026
A lot to look at this week. The Expense Report is rebuilt as a friendly spending explorer — a stacked monthly chart, a Category / Merchant toggle, and a click-anything-to-drill-in drawer. Scenarios got a major boost: there’s a lot more you can tweak in a what-if, and you can now copy a hypothetical row from one scenario into another. The Forecast is more accurate on long-range projections, and the Subscriptions Report finds more real subscriptions while ignoring the false ones.
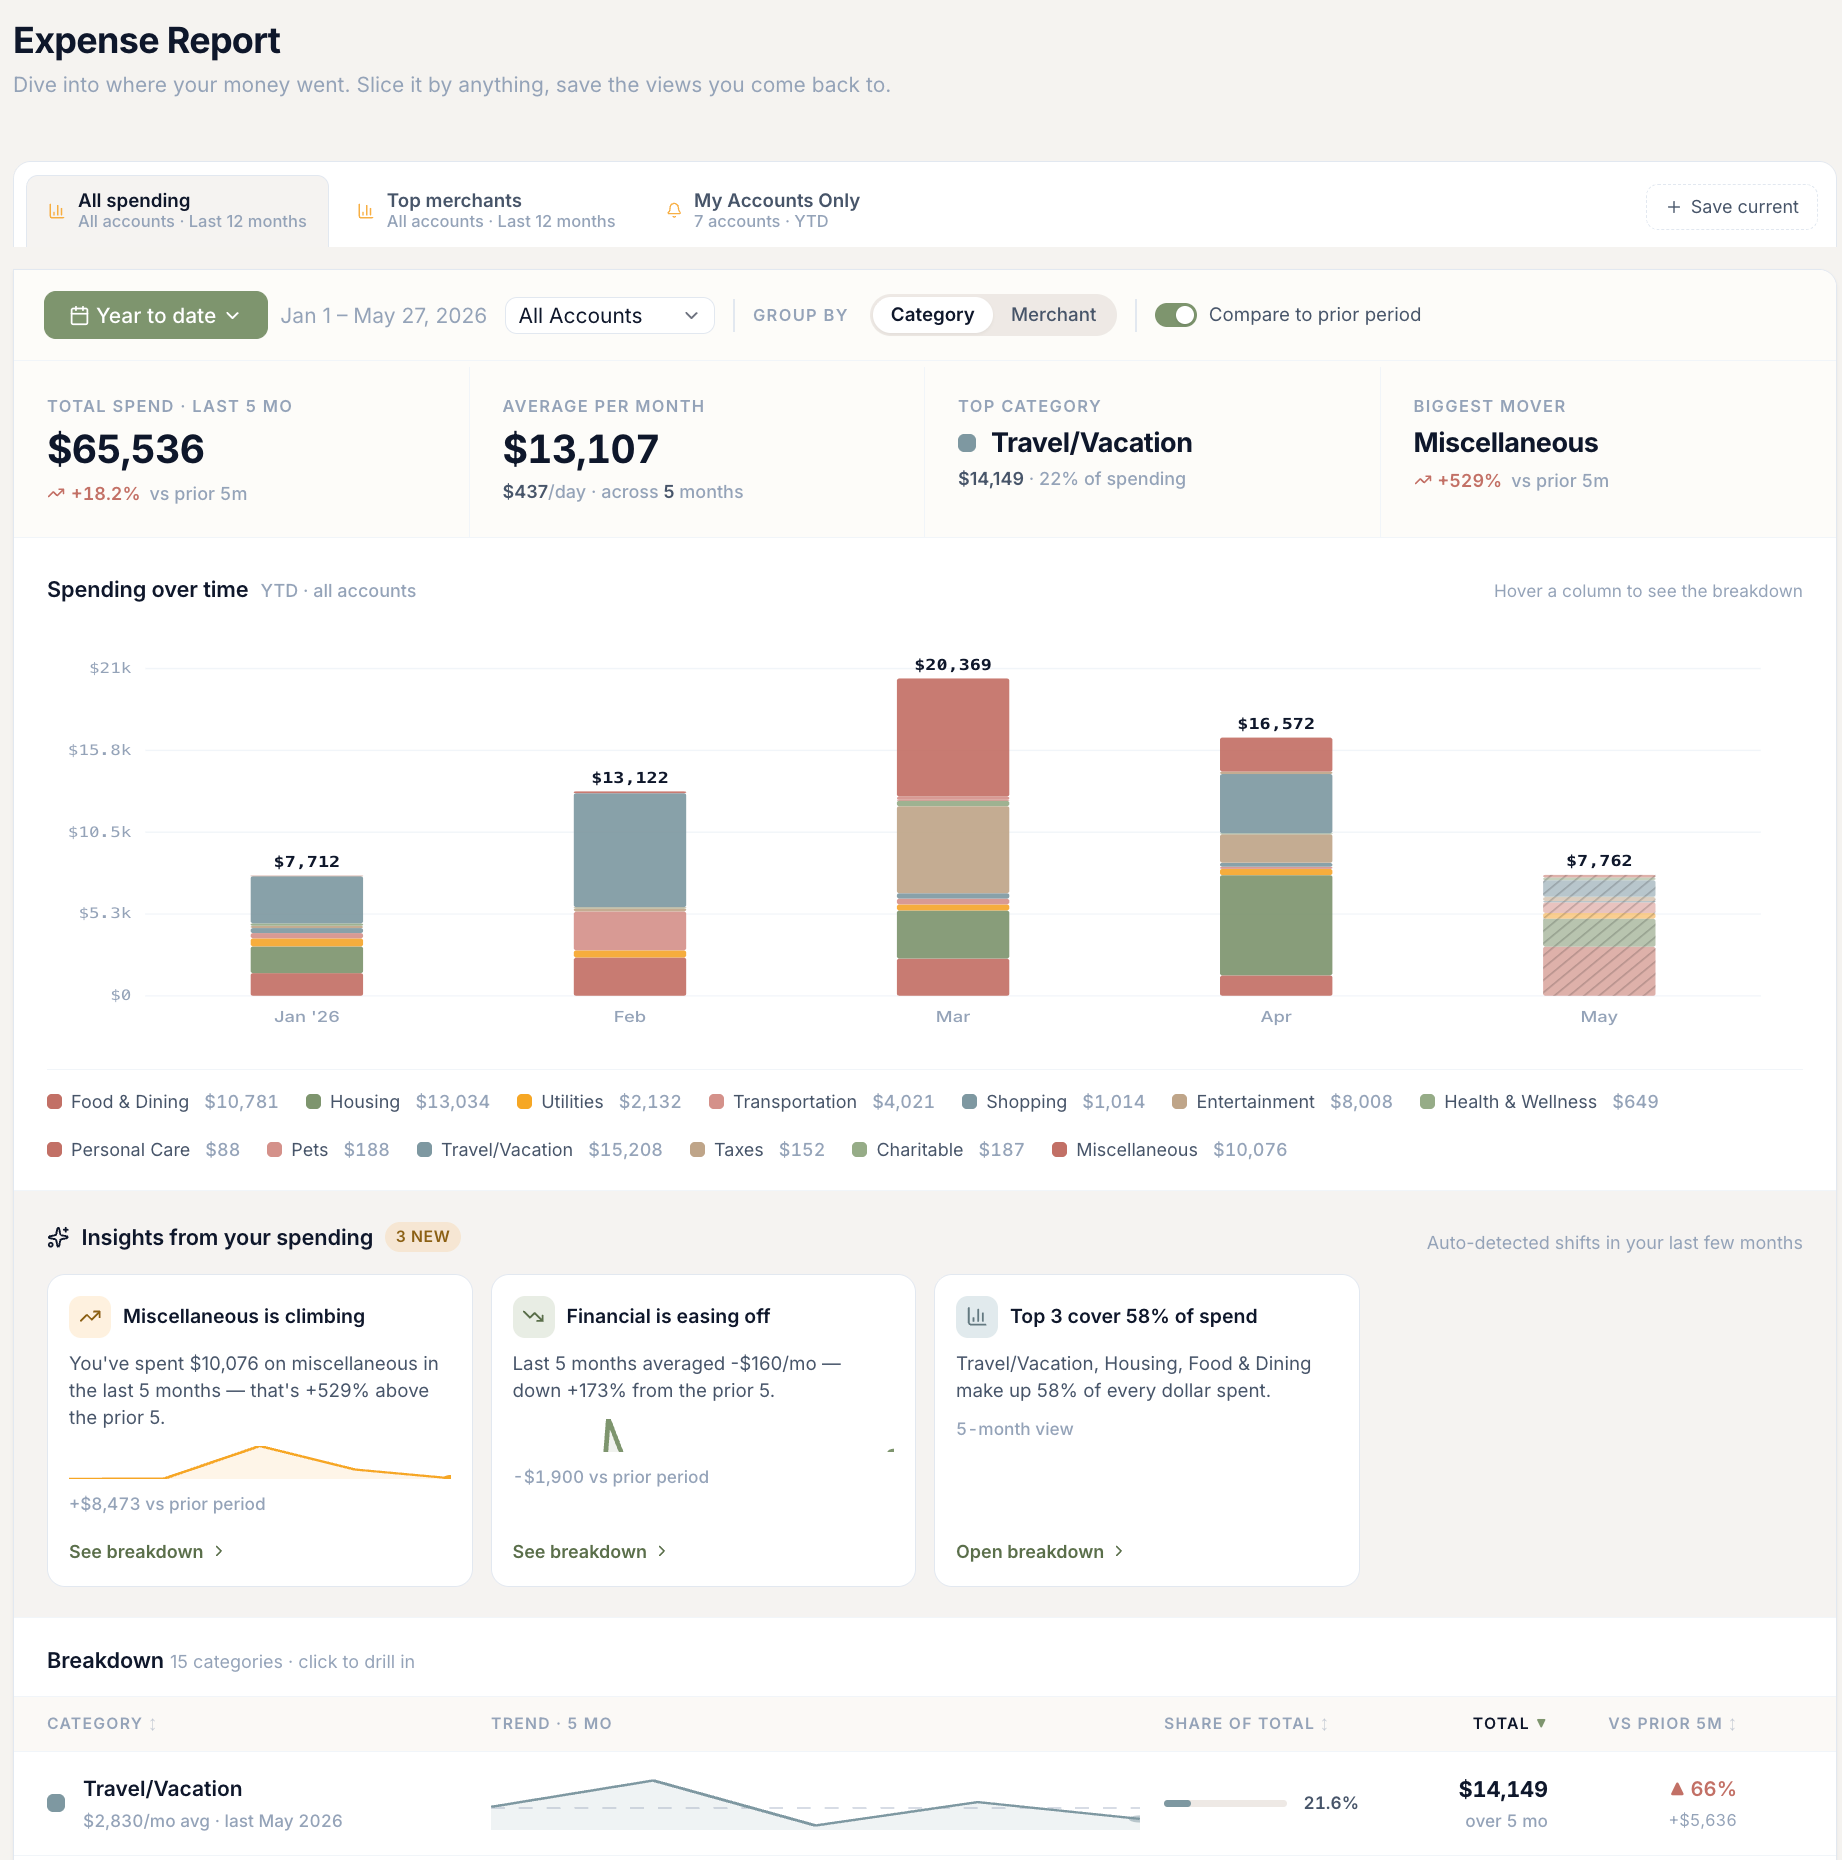
A friendlier Expense Report
The Expense Report is rebuilt around one question: where is my money actually going? A stacked monthly chart shows your spending built up category by category — or merchant by merchant, your call. Auto-detected insights call out the biggest movers. Click any slice and a drawer slides in with the underlying transactions. Saved views are stored with your account now, so they show up on every device you sign in from.
- Category or Merchant — one toggle. Flips the chart, the breakdown table, and the pie chart all at once.
- Filter by account. Look at just the spending on one card or one checking account.
- Refunds count the right way. A category where you got back more than you spent now shows up as a net negative, instead of being hidden.
- Saved views follow you. The "Top spending — last 90 days" view you saved on your laptop is waiting on your phone.
Scenarios — change almost anything in a what-if
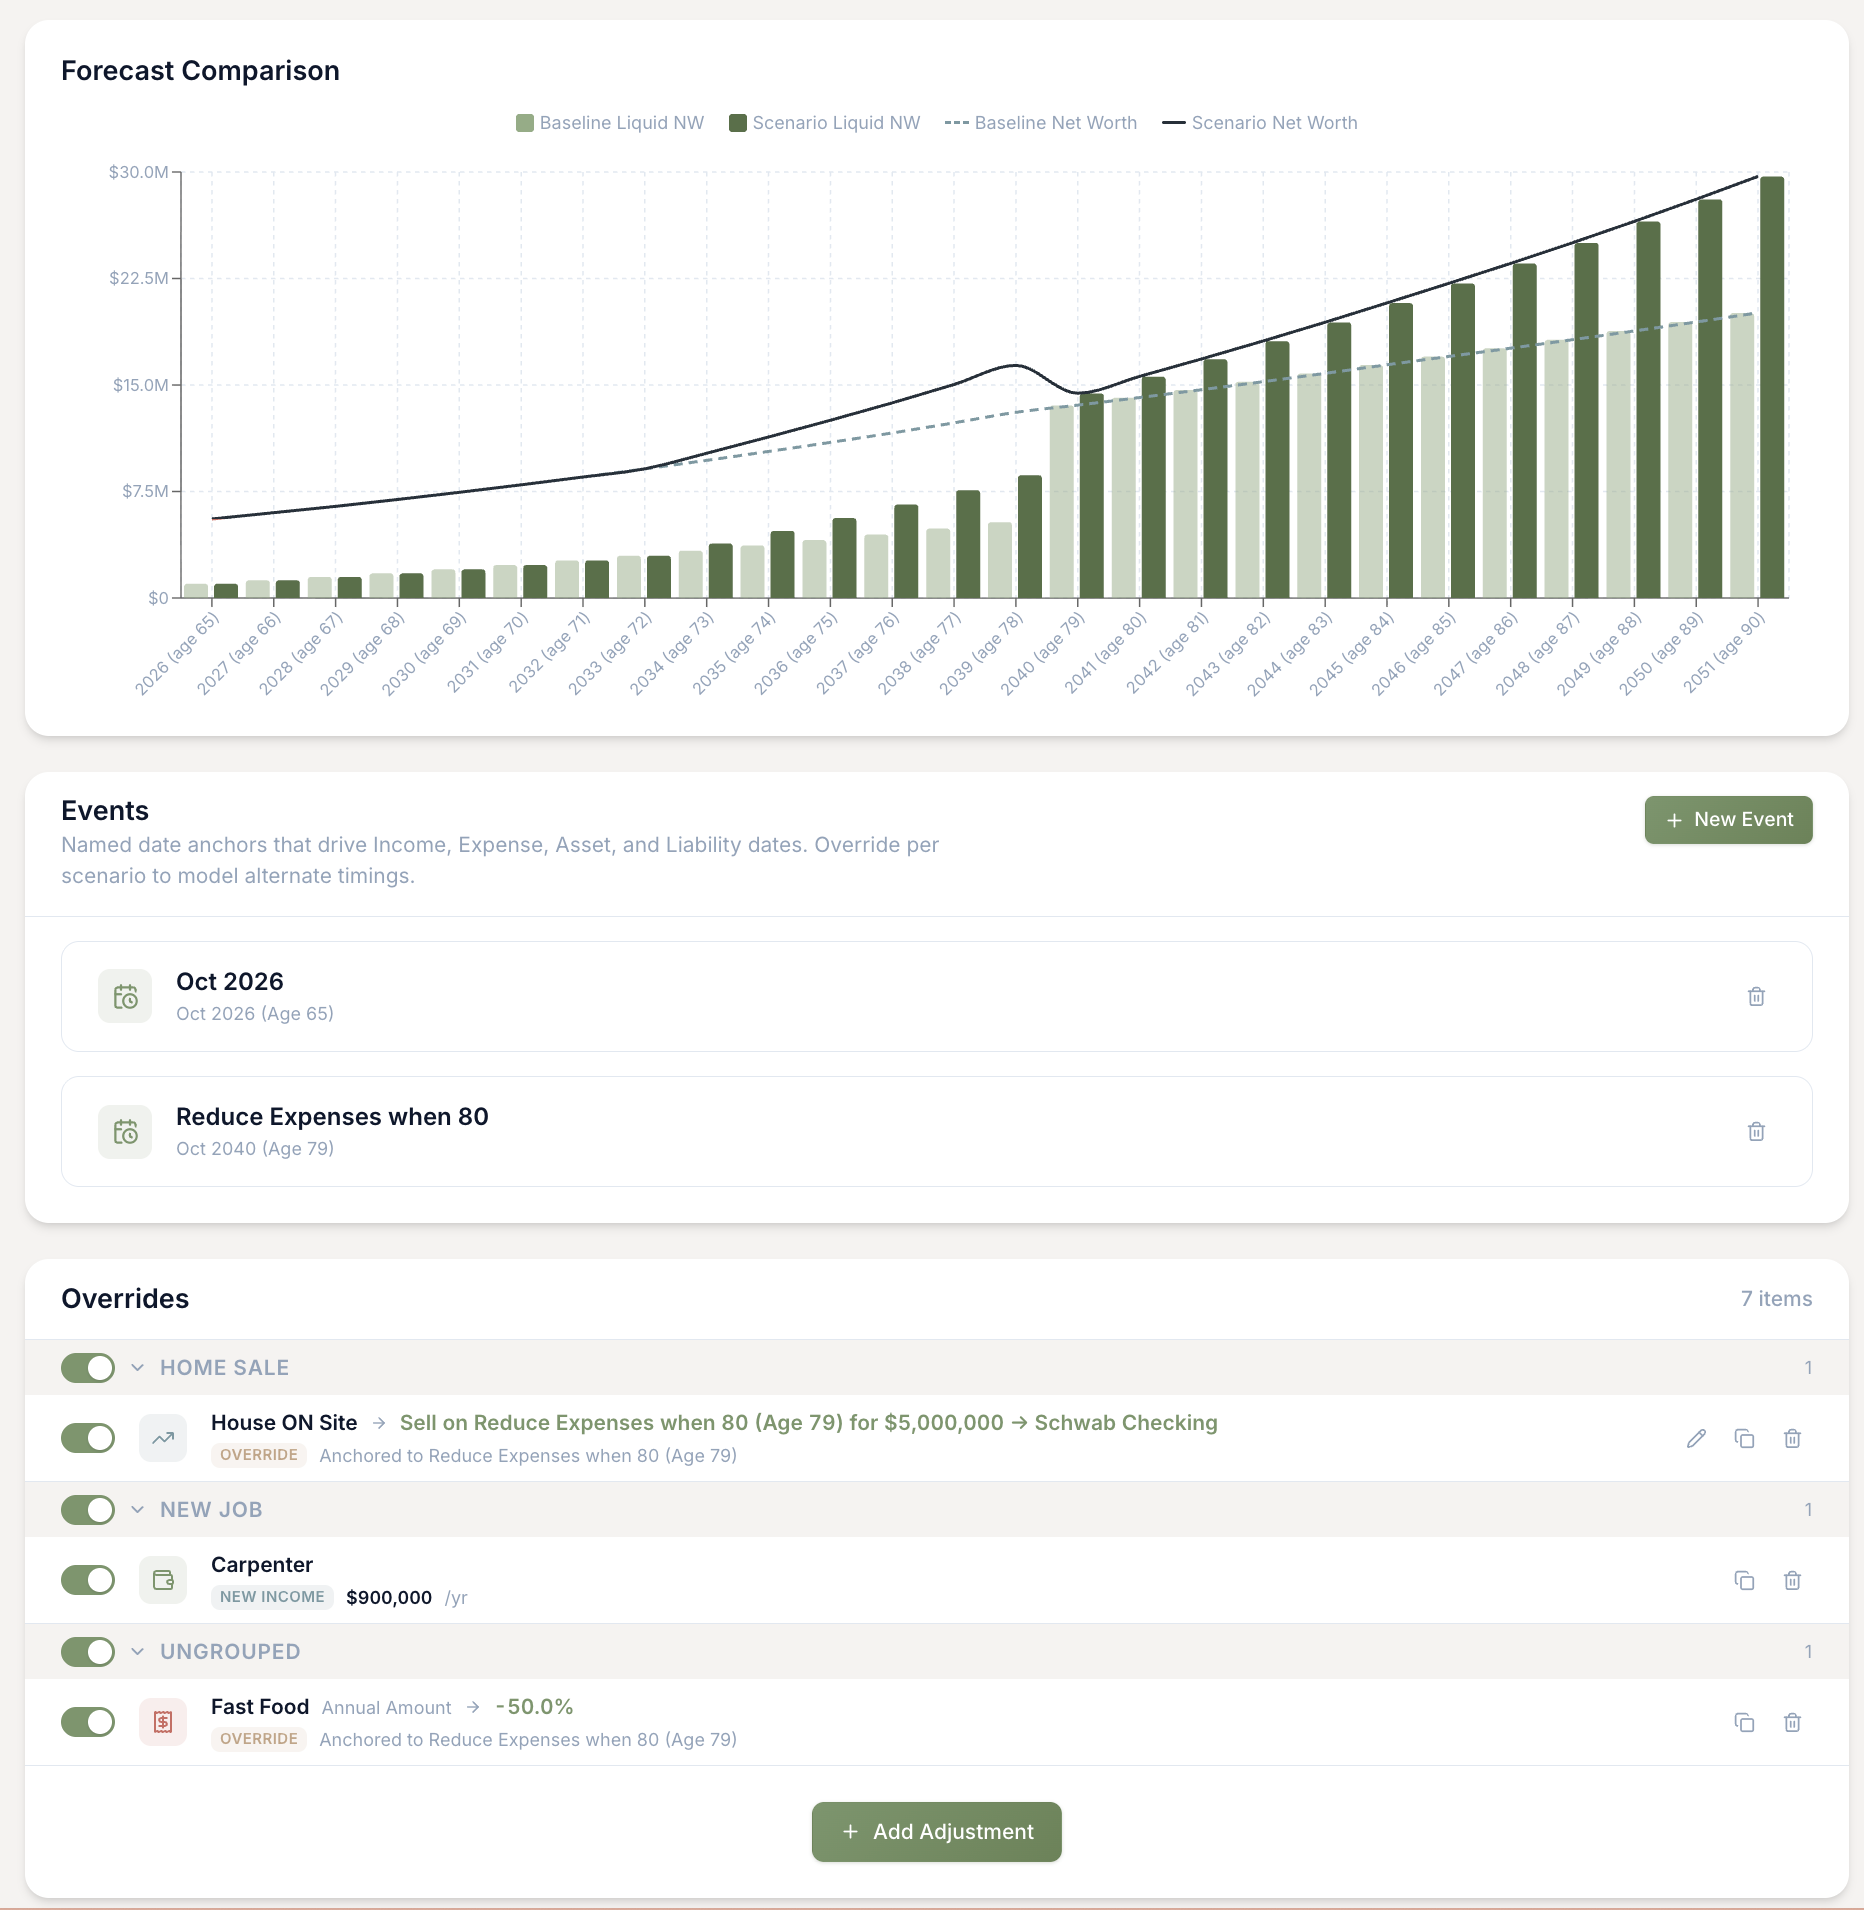
Scenarios used to let you nudge the obvious fields: a salary, an expense, a savings rate. Now you can override almost any field on your income, expenses, assets, liabilities, and planned distributions — the kind of details that quietly drive long-range outcomes. And any hypothetical row you’ve added inside a scenario can now be copied into another scenario, so you don’t have to rebuild a "what if I bought a second home" asset every time you want to test it against a different plan.
- So many more fields to override. Tax treatment on an income, the source of funds on an expense, custom capital-gains rates, loan terms, lease sub-fields — all overridable per scenario.
- Copy hypothetical rows between scenarios. A "second home" asset you added to one scenario can be copied into another in a click, instead of being rebuilt from scratch.
- The Forecast page tells you which year is scenario-driven. Small tags appear wherever a scenario item is influencing a number, so you can see at a glance what’s coming from where.
Long-range forecasts are now more accurate
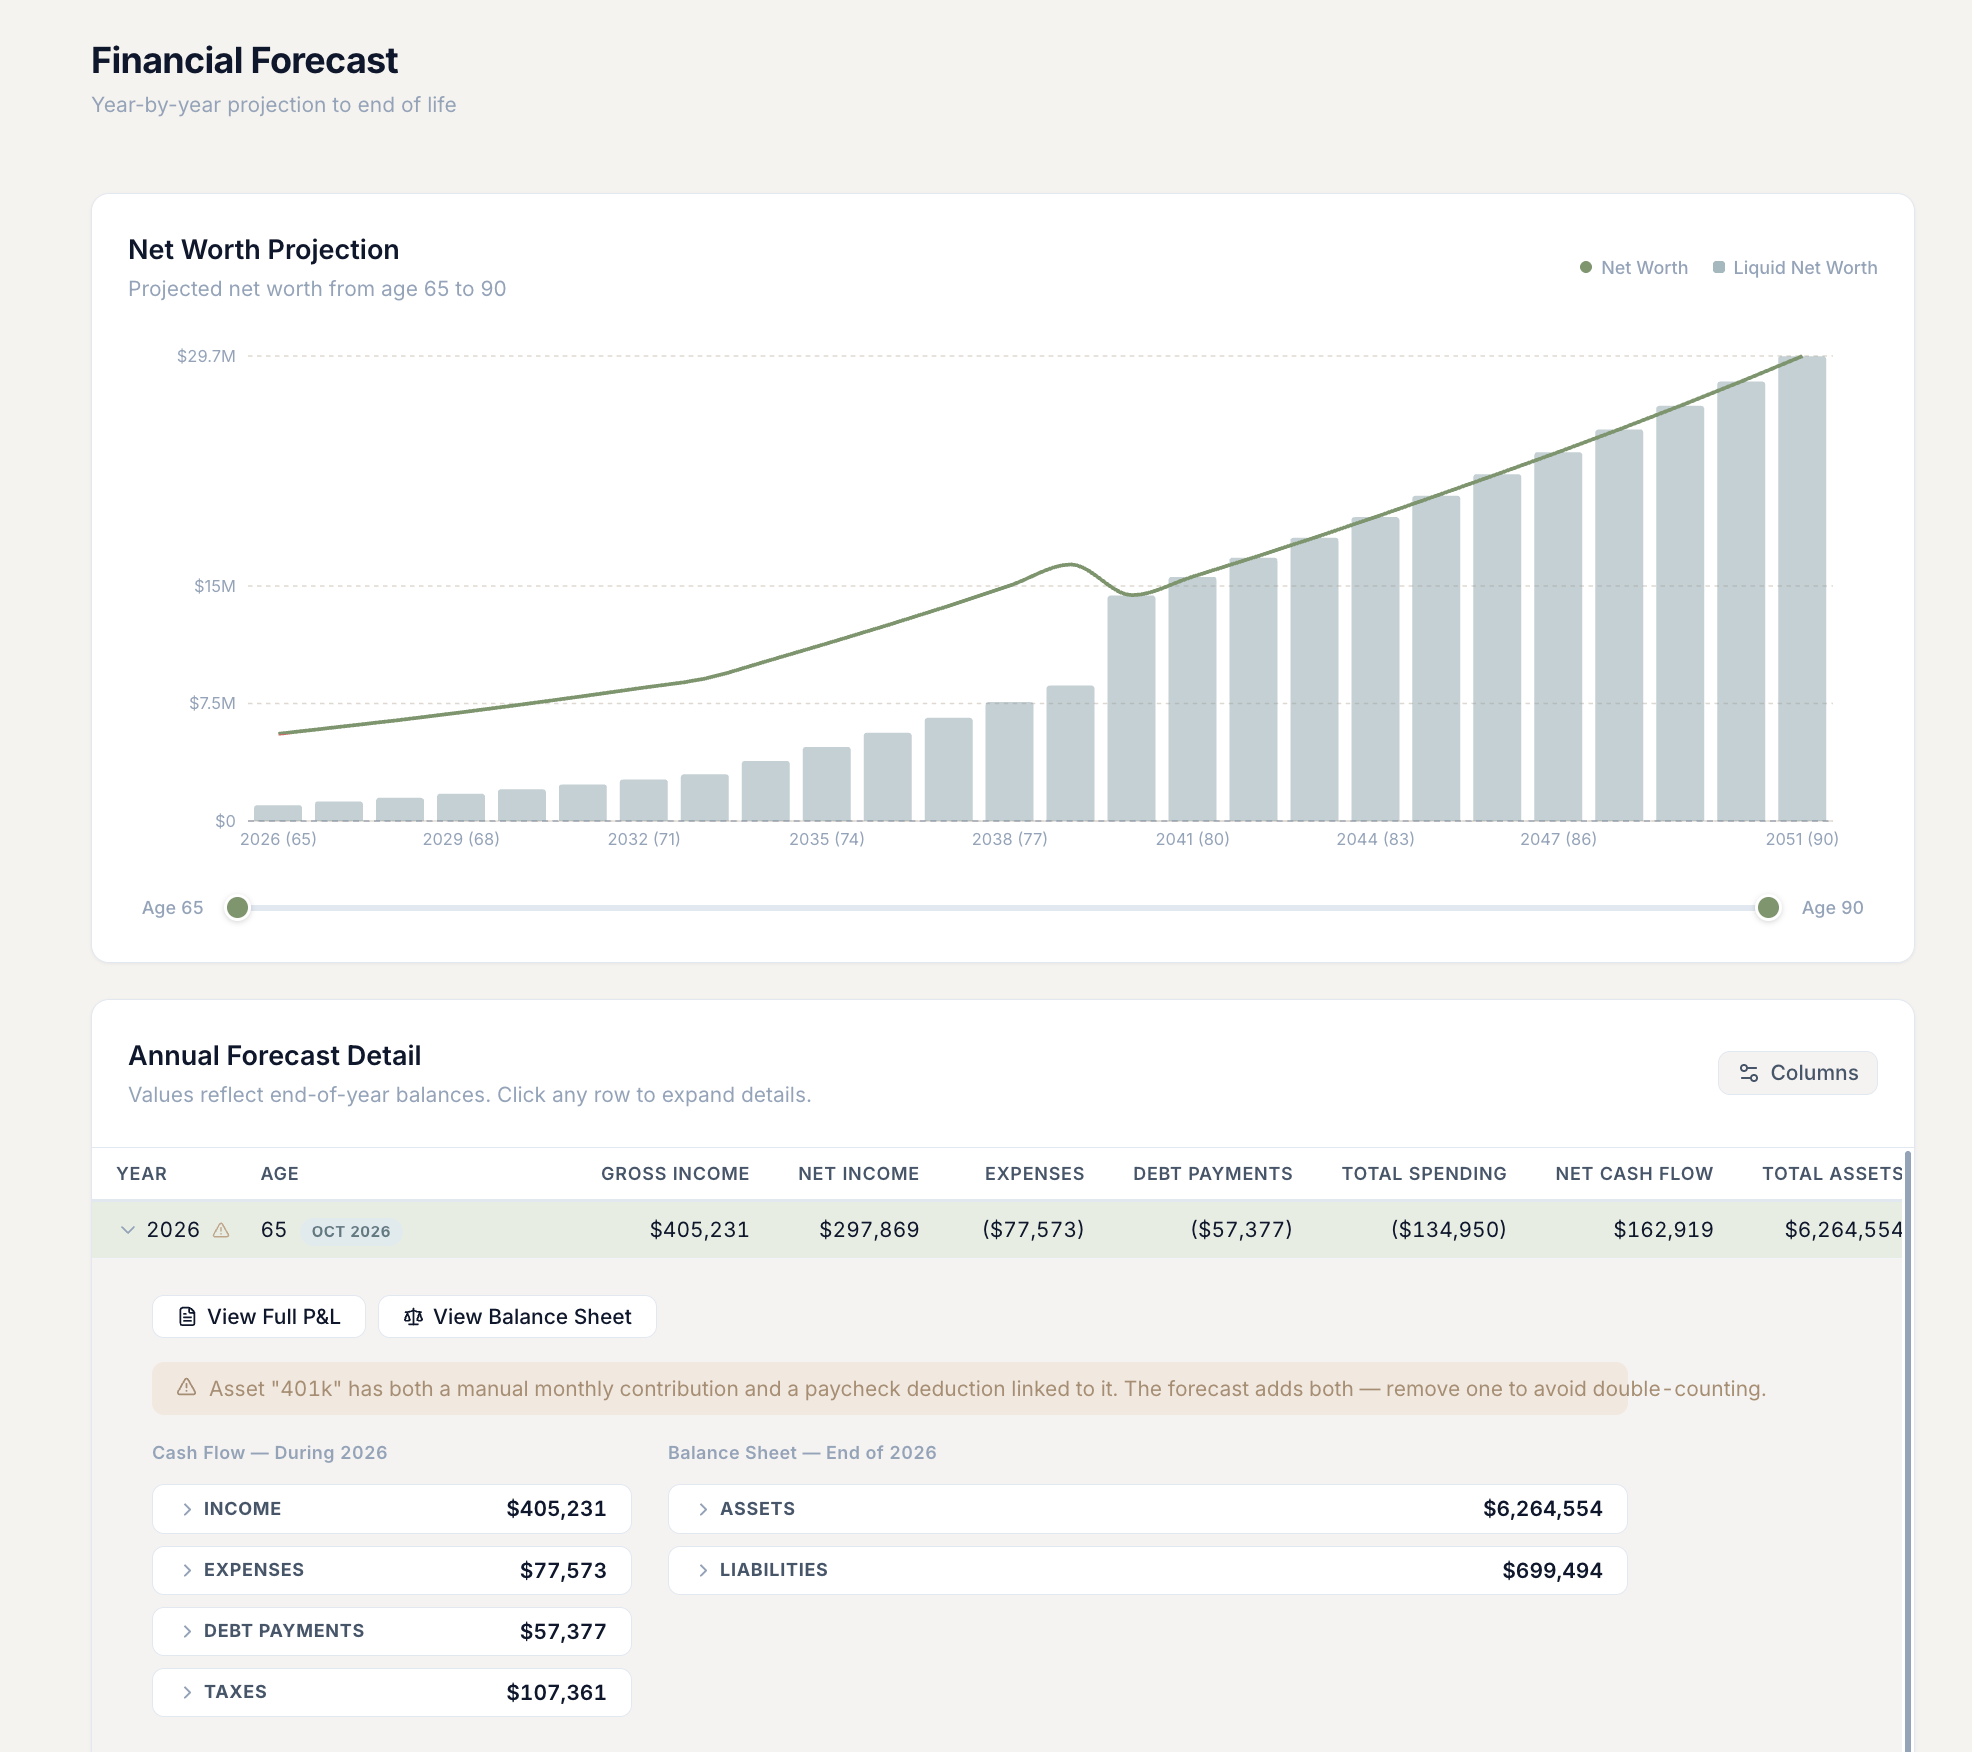
A round of corrections to how the forecast handles taxes — most visible when you’re looking 20 or 30 years out. Tax brackets and similar thresholds now grow with inflation instead of staying frozen in today’s dollars. State taxes are calculated state-by-state. Roth and 457(b) accounts are treated correctly. And a custom capital-gains rate set on an asset now applies everywhere it should.
- Tax brackets grow with inflation. No more accidental bracket creep across decades.
- State taxes done state-by-state. Each state’s own standard deduction (or none, where there isn’t one) is now used. A handful of states that tax retirement contributions are handled correctly.
- Roth and 457(b) treated right. Roth accounts flow tax-free with no required distributions; 457(b) is pre-tax. Both are now their own account types so the forecast doesn’t mix them up.
- Custom cap-gains rates apply everywhere. A custom rate you set on an asset now flows through sales, partial draws, and any other way money comes out — not just one of them.
Subscriptions Report finds more, and false-flags less
The Subscriptions Report had two opposite problems: it was missing real subscriptions (two charges from the same merchant on different cards collapsed into one), and it was flagging things that weren’t subscriptions (a few grocery runs near the same amount got picked up as recurring). Both are fixed.
- Two memberships at the same gym now both show. One per spouse, on different cards, as separate rows.
- Variable merchants stop sneaking in. Groceries, restaurants, gas — places where the amount swings — no longer get flagged as subscriptions just because of a coincidence.
- Weekly subscriptions get caught. A same-day-each-week recurring charge now surfaces instead of slipping past the monthly/annual check.
- Account column is friendlier. When a charge is tied to a credit card, you see the card’s nickname, not a generic account.
Quality-of-life improvements
Smaller upgrades you'll probably notice.
Linked Payments now work with every account
You can now point a transaction at any asset or liability you have, not just a narrow set of manual loans. For accounts that Plaid, Tiller, or SnapTrade are already syncing, the link is just a reporting tag — your balance stays accurate and nothing gets double-counted.
Mortgage payments split themselves
Once a mortgage is set up with its parts (principal & interest, taxes, insurance, PMI), every new payment imports already split. Budget vs. Actuals lines up category-by-category instead of dumping the whole payment into one bucket.
Send income straight to a chosen account
Every income now has an optional "Deposit into…" picker. Your bonus can land in your brokerage, your rental income in a dedicated savings account. The forecast then deposits the take-home into that account before everything else gets allocated.
The Transactions page got the same date picker as the reports
No more year/month dropdowns — the Transactions page uses the same nice date control as the Expense Report, P&L, and Budget vs. Actuals. The Category filter is also now a multi-select with search, like the Account filter.
Transaction totals moved to the top of the page
Income, Expenses, and Net for whatever you’re looking at are now an always-on strip above the table, with a "Filtered" pill when you’ve narrowed things down. Same info, just where your eyes already are.
You can now hand-enter a refund
Adding a manual transaction used to reject any non-positive amount, which meant you couldn’t enter a refund or a credit. Now any non-zero amount works, and the sign sticks around even if you re-categorize the transaction later.
Asset Performance gets a Daily view and an account filter
You can now drill into a single account and pick a Daily granularity for shorter windows. Very long ranges automatically nudge you back to a coarser interval so the chart stays fast.
Performance chart is red below zero, green above
The cumulative return chart now colors itself by gain or loss, with a dashed zero line. A losing streak looks like a losing streak; a recovery looks like a recovery.
"Exclude from Reporting" on a category is now safer
Hiding a whole category used to permanently re-flag every transaction underneath, which led to weird side effects. Now it’s a clean on/off switch: turn it on and the category disappears from every report instantly; turn it off and it comes back without touching anything you’ve hidden by hand.
Ages show up next to years almost everywhere
Year dropdowns on the Forecast, the Events panel, and the override summaries now read "2030 (Age 47)" instead of just "2030." Less mental math.
The "Accounts connected" tile actually counts accounts
The number on the dashboard was counting institutions (your one Chase login, your one Vanguard login) instead of the actual accounts under them. Now it counts what it says it counts.
Schwab/SnapTrade now warn you when they need reconnecting
When the brokerage invalidates your authorization, you’ll now see a clear alert instead of silently stale data. Connections that haven’t refreshed in 48+ hours get a "Data Not Refreshing" badge so you know exactly what to do.
Fixes
Small things that were wrong. Now they're right.
- Long-range forecasts no longer drift into phantom tax-bracket creep — federal and state brackets, the Social Security cap, and similar thresholds now grow forward with inflation.
- State taxes now use the right standard deduction for each state (or none, where the state doesn’t have one), and a handful of states that tax retirement contributions are now handled correctly.
- Roth 401(k), Roth 403(b), and 457(b) are now separate account types with the right tax treatment. Paystub deductions can target any of them.
- A custom capital-gains rate on an asset now applies to every kind of withdrawal — not just one.
- Forecast income growth no longer over-compounds when an income started years ago.
- Scenario "Percent Change" overrides apply to a stable baseline now, so a "+5% per year" override grows like you’d expect instead of compounding on top of itself.
- Scenario overrides that change an asset’s current value now scale the cost basis along with it, so what-ifs don’t generate fake capital-gains tax.
- Two gym memberships at the same gym (one for each spouse) no longer collapse into a single row in the Subscriptions Report.
- High-variance merchants (groceries, restaurants, gas) no longer get falsely flagged as subscriptions just because a few charges happened to cluster.
- Two same-day, same-amount transactions from the same source (two identical Zelles, two same-priced coffees) no longer silently merge on import.
- Household members whose access comes from a lifetime/paid owner no longer see "trial ending" or "trial expired" banners.
- Accepting a household invitation now signs you in fresh, so the shared data appears immediately instead of after a 15-minute wait.
- Budget reports: rollover categories no longer double-count their carry-forward in YTD totals.
- Budget Pulse: rollover categories with a negative budget no longer show as "under budget" by mistake; the Trend view now matches the rest of the report.
- Asset Performance: no more 500 error when you select a single account from the filter.
- Forecast: event badges no longer show for life events that aren’t in use in the active scenario.
- Forecast: expanded year panels stay inside the column width instead of blowing out the layout.
- SnapTrade reconnect no longer fails when the brokerage returns an empty authorization id.
- Categories: the Save / Cancel buttons when renaming are now easy to see, and the mobile categories table no longer cuts off the category name.
Take the new Expense Report for a spin
Sign in, head to Reports, and open the Expense Report. Toggle between Category and Merchant. Click a pie slice. Save the view you end up at — it’ll follow you to every other device you sign in from.