What's new in Tally
June 21 – July 3, 2026
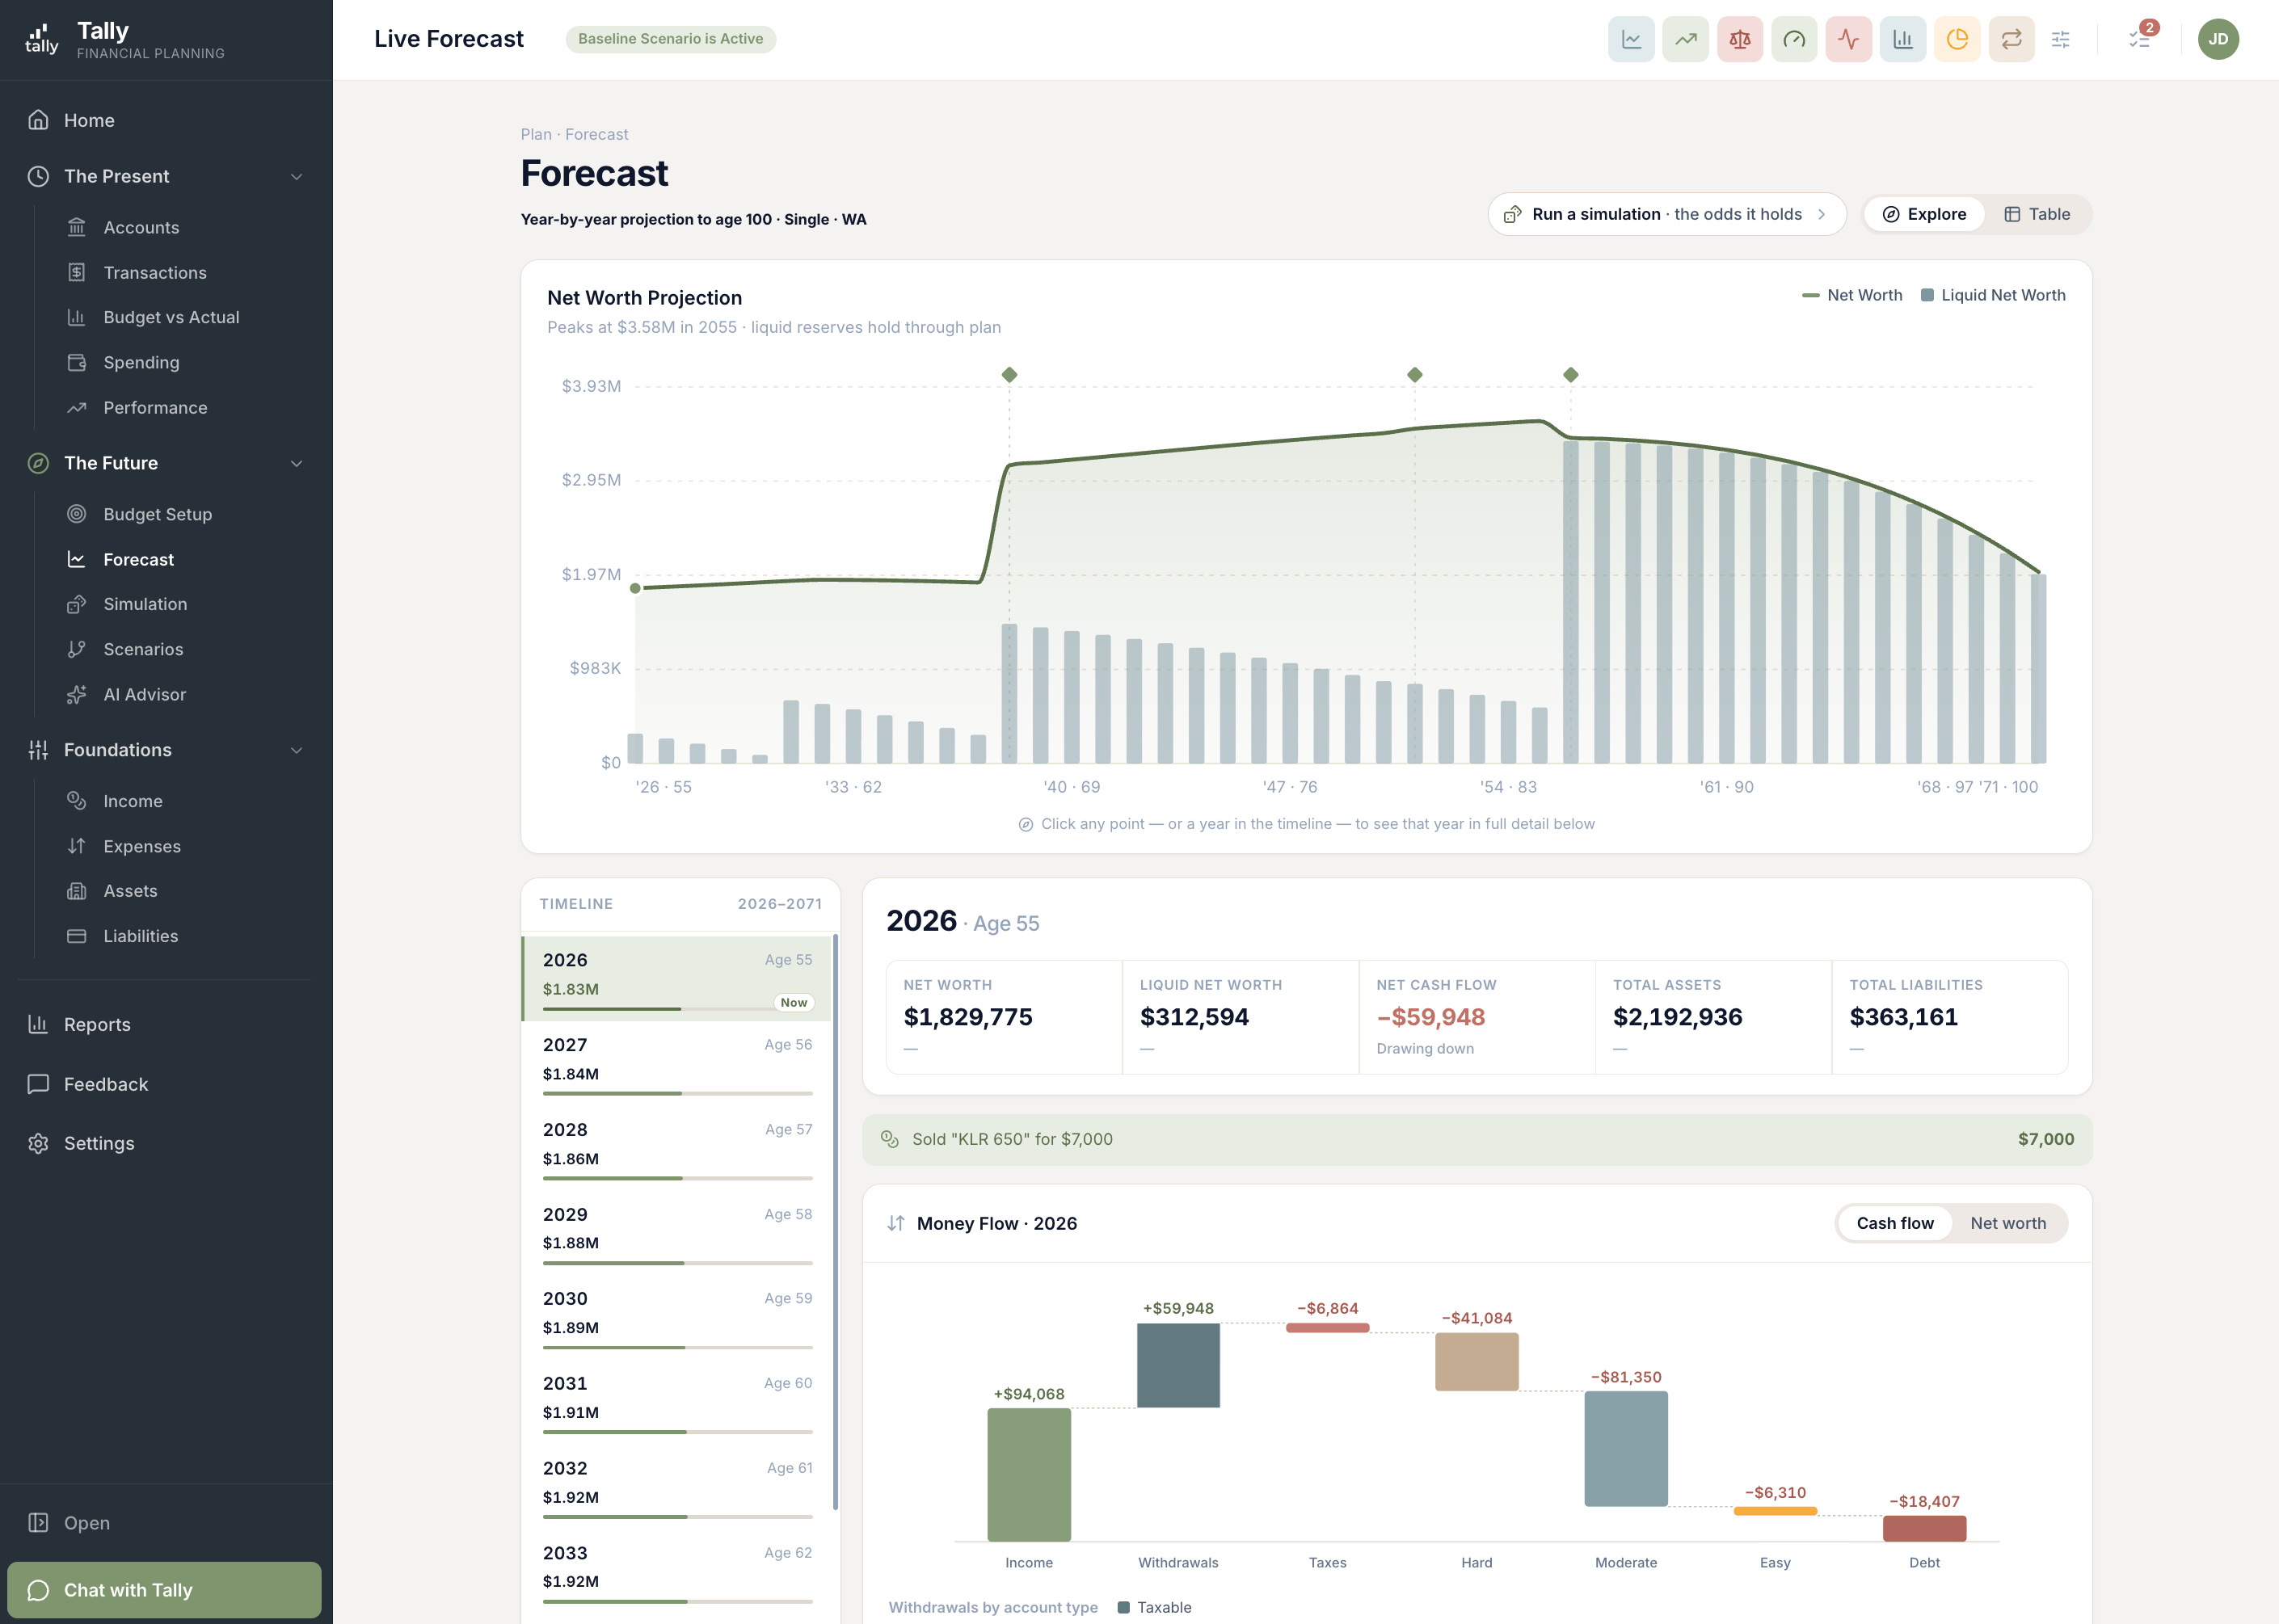
The big one this time: the Forecast page got a ground-up redesign. Instead of one long chart and a wall of numbers, the new Explore view puts a year-by-year timeline beside the chart — click any year and see its whole story: the headline numbers, everything that happens that year, and a money-flow statement that reads like a narrative of where every dollar came from and went. Also in this release: a rebuilt welcome for new members, saved views that work the same on every page, a better way to shape life events, sharper reports, and brokerage balances that refresh right after the market closes.
The Forecast is now a place you can explore
Your forecast spans decades — the old page asked you to take it in all at once. The new Explore view works the way you actually think about the future: one year at a time. A timeline runs beside the projection chart; click any year (or any point on the chart) and the page opens that year up — what you’re worth, what comes in, what goes out, and every planned event that lands in it.
- Pick a year, see its whole story. Net worth, liquid reserves, cash flow, total assets and liabilities — plus the events of that year, like a sale or Social Security starting, shown right where they happen.
- A money-flow statement, not a data dump. Income, withdrawals, taxes, spending, and debt payments step down a single waterfall chart, so you can see how the year balances — and flip between the cash-flow and net-worth lens.
- Detail that keeps its bearings. When you expand an asset or liability and scroll through the years, the header stays pinned so you always know what you’re looking at.
- The Table view is still there. One click switches to the full year-by-year grid when you want every number at once.
A welcome that shows you your money first
Getting started with a finance app usually means a long form before you see anything useful. We rebuilt Tally’s welcome around the opposite idea: connect your accounts and Tally assembles a live preview of your finances — your net worth, your spending, the beginnings of a forecast — before asking you to do any setup work. Then a guided tour walks you through your first look, with an assistant docked alongside to answer questions as you go.
- Value before paperwork. See your actual numbers taking shape within minutes of connecting — the fine-tuning can come later, at your pace.
- A guided first look. The tour walks you through where your net worth, spending, budget, and forecast live, one spotlight at a time.
- Skippable, always. Already know your way around? Dismiss the tour and it stays out of your way.
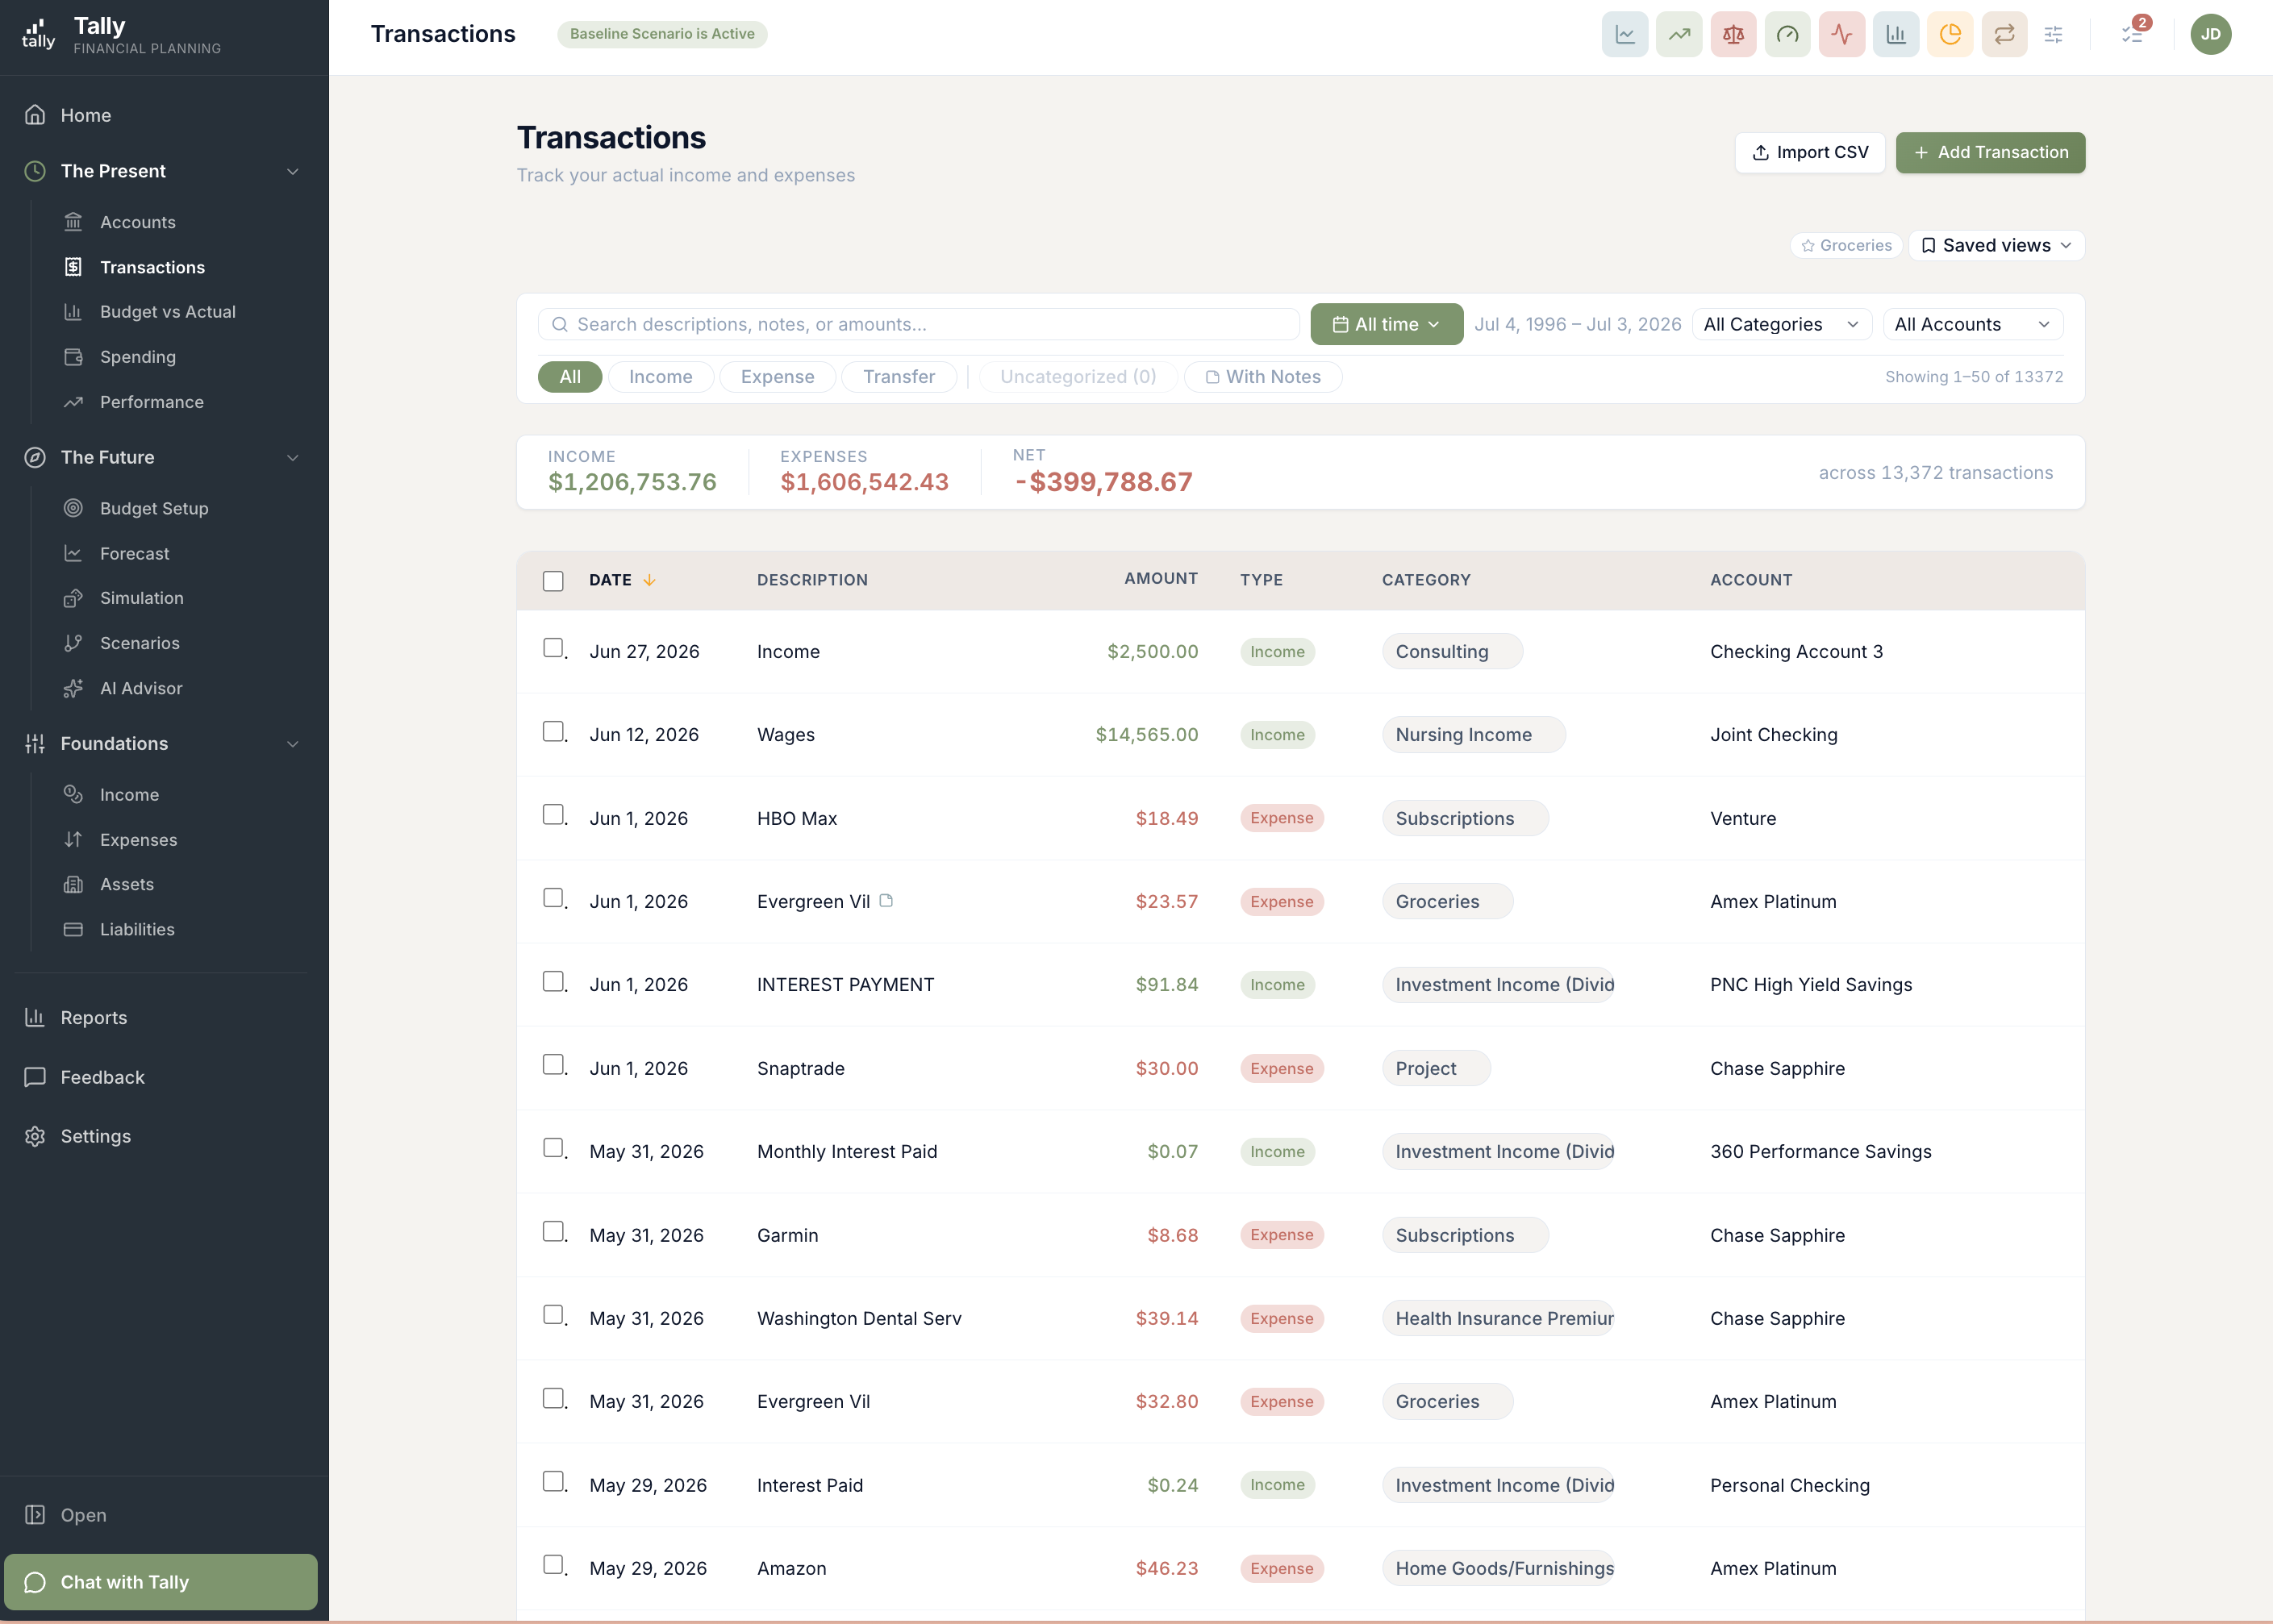
Saved views: one control, every page
Build a filter you like — say, groceries on the joint card this year — and save it by name. Saved views now work identically across the four pages where you slice your data, and because they’re stored in your account, the view you save at your desk is waiting on your laptop.
- Save it once, name it, reuse it. The Saved views control remembers which view you’re in and shows it right on the page.
- Know when you’ve wandered. Tweak a filter and a small dot appears on the view’s name — update it with one click, or save the tweak as a new view.
- Clear filters, one click. A single button takes any page back to a clean slate.
- Follows you everywhere. Views live in your account, not your browser — new laptop, phone, incognito window, all the same views.
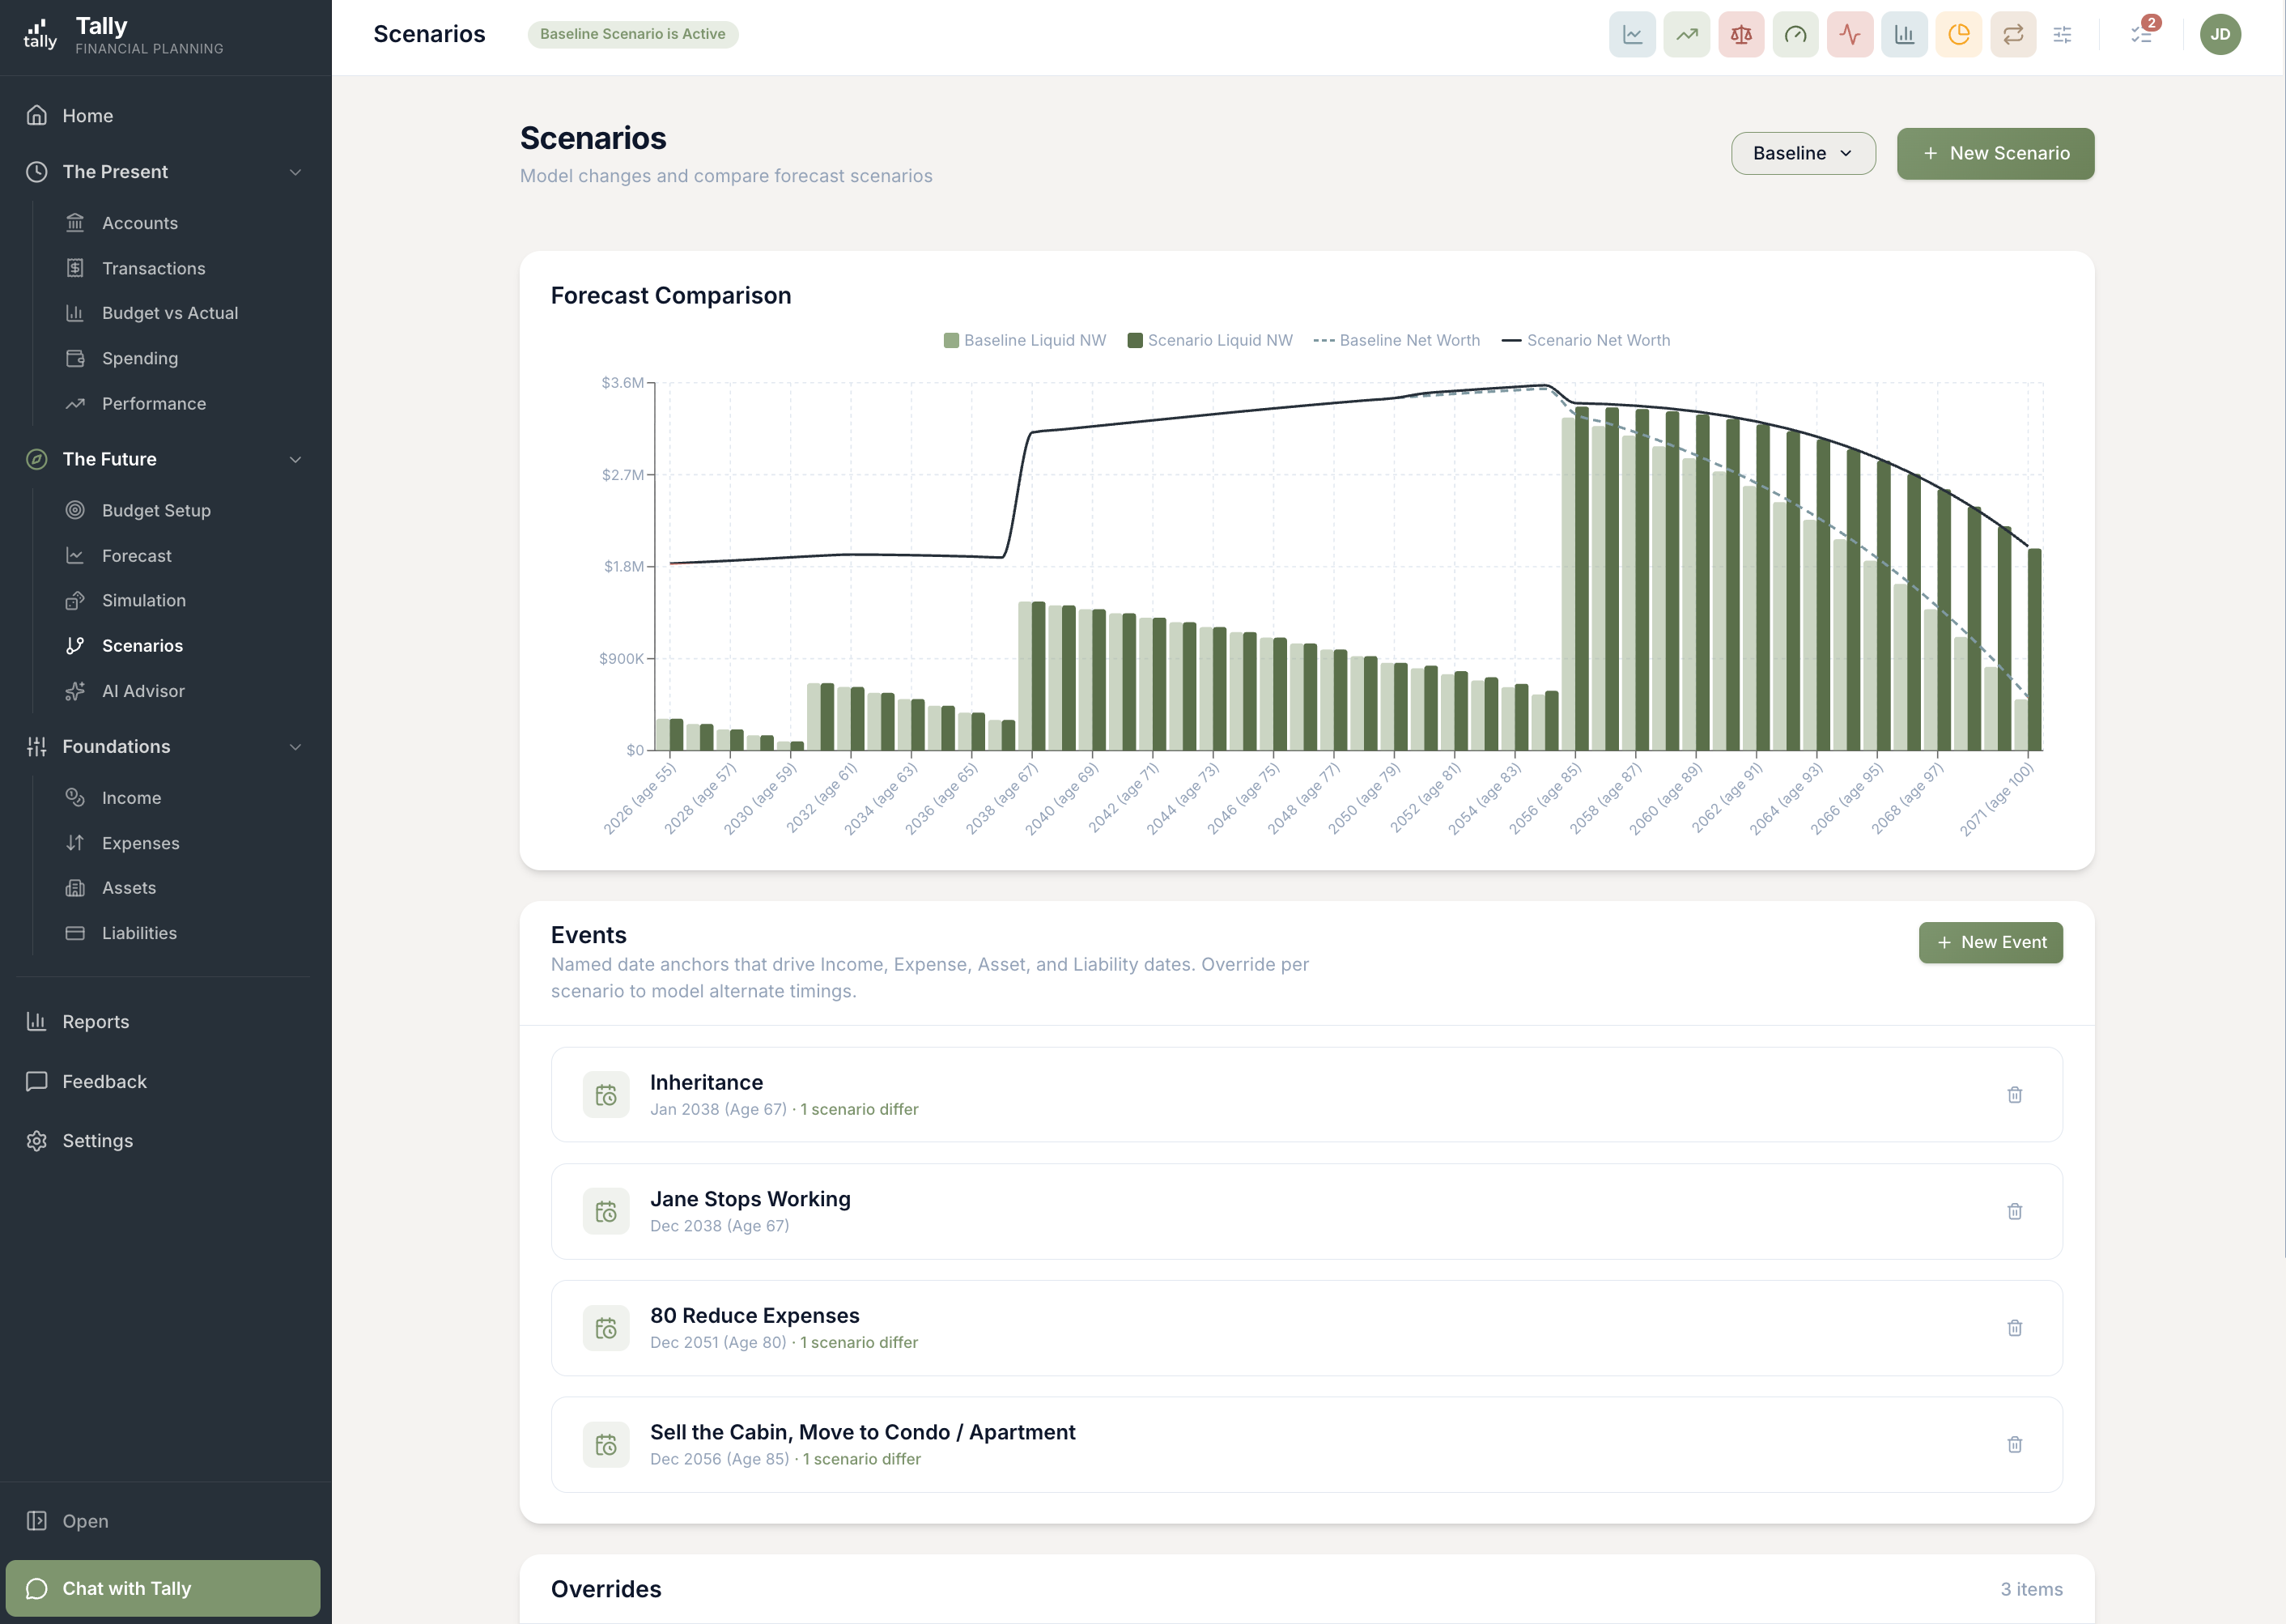
Life events are easier to shape — and safer to change
Events are the hinges of your plan: the retirement date, the home sale, the year a kid starts college. This release makes them easier to work with. Creating and editing now happens in a side drawer so you never lose your place, and before you move a date, Tally shows you exactly what that date drives.
- Edit in place. Events open in a drawer beside your plan instead of a page-covering form — make the change, watch the chart react.
- Scenarios show their own dates. When you’re working in a what-if scenario, every date you see is that scenario’s date — no more guessing which timeline a number belongs to.
- "Where this date is used," spelled out. Each event lists the incomes, expenses, and asset moves hanging off it, so you know the ripple effects before you drag the date.
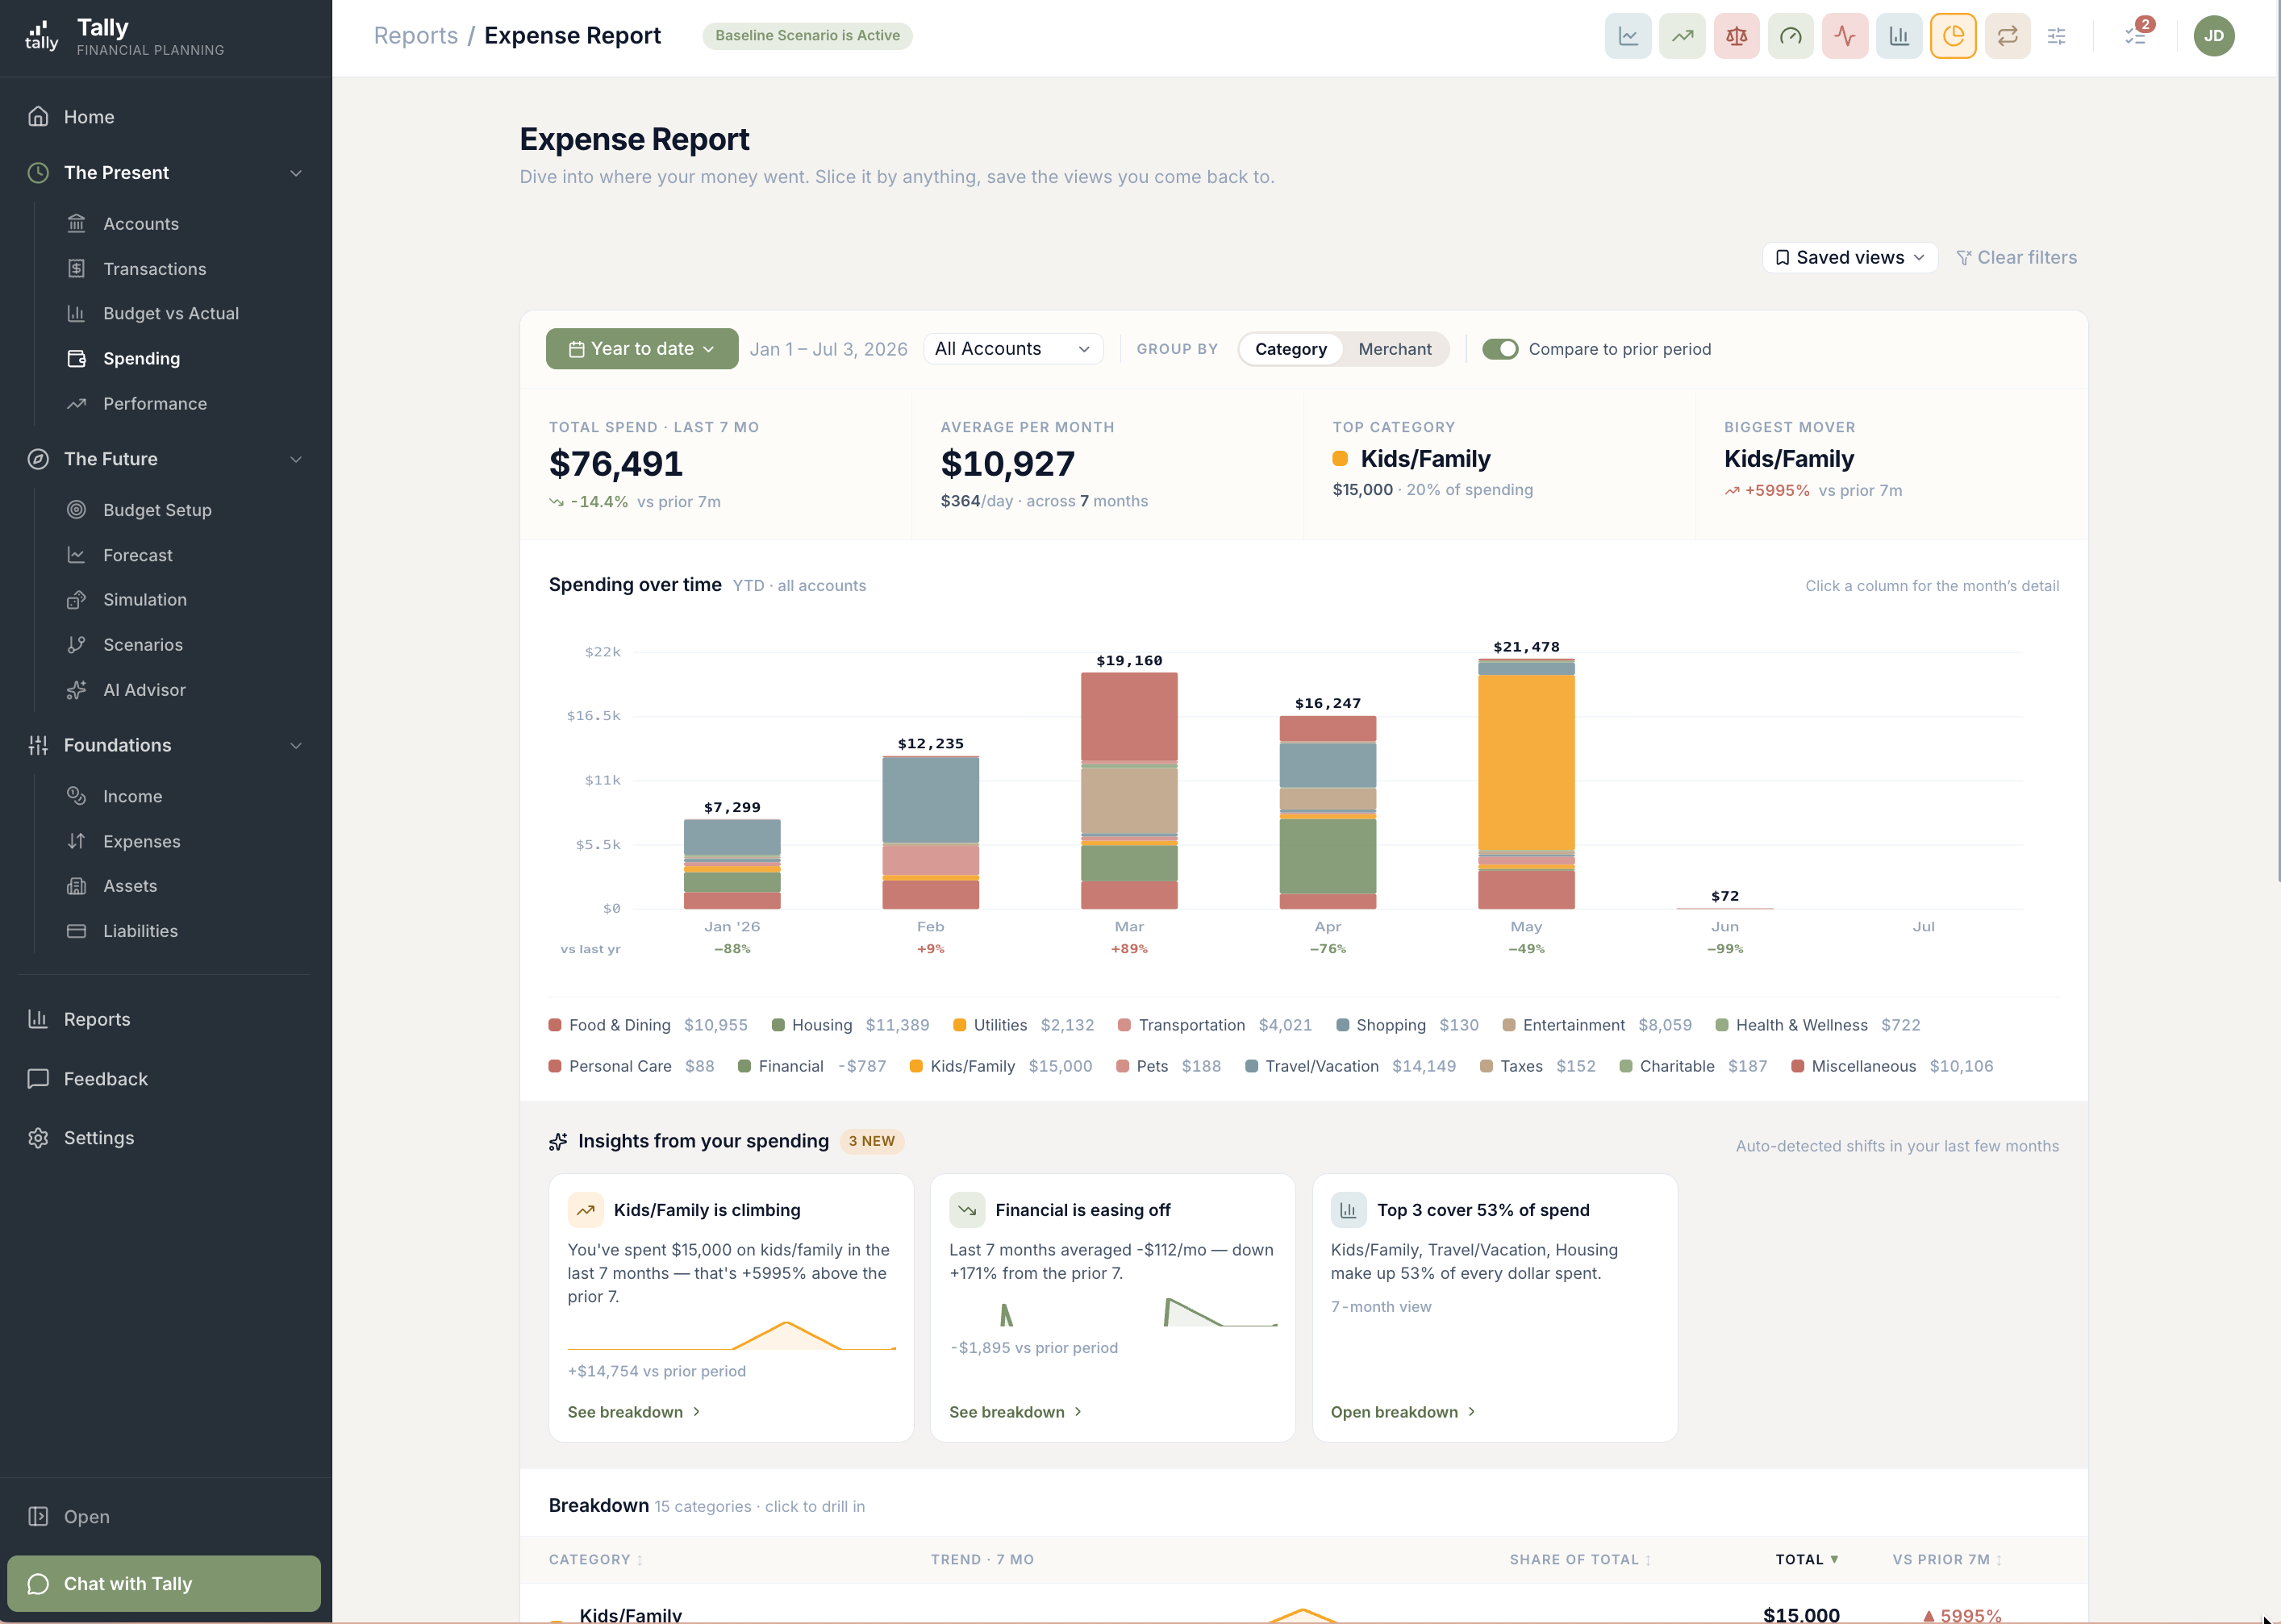
Reports that answer the next question
A good report answers the question you asked; a great one anticipates the follow-up. This release closes the gap between "that number looks odd" and "now I understand it" across the Expense Report, Budget Pulse, and Subscriptions.
- Click a month, get the detail. Expense Report months open into a drawer with that month’s transactions, a year-over-year note explaining how it compares, and an icon on any transaction that carries a note.
- Budget Pulse shows the gap, not just the bar. Every row now shows the dollar difference and the over/under percentage, with one consistent definition of "on budget" across the page.
- Subscriptions you can correct. The report now shows each subscription’s true latest charge and how it changed from the one before — and if Tally gets one wrong, you can tag or untag it yourself and it stays put.
- Dates you can type. Report date ranges accept typed dates now, the calendar is smarter about where it opens, and a Today shortcut jumps you back to the present.
Simulations remember their results
Last month’s big launch got a round of refinement based on how people actually use it. The theme: your results should be there when you come back, and honest about whether they’re still current.
- Results are saved between visits. Open the Simulation page and your last run loads instantly — no waiting through a re-run just to look at the odds again.
- Honest about staleness. If your plan has changed since the last run, Tally says so plainly — and it never re-runs behind your back. You decide when the dice roll.
- Easy cuts vs. hard cuts. The belt-tightening analysis now separates spending you could trim painlessly from cuts that would genuinely hurt — and leans on the easy ones first, the way you would.
- One currency of truth. Results are always shown in future dollars, so the fan chart, the odds, and your forecast all agree with each other.
Investment balances, fresh by dinnertime
Brokerage and retirement accounts now sync a second time each day, shortly after the market closes — so an evening check-in shows today’s close, not yesterday’s. Connecting and growing those accounts got easier too.
- An after-close sync, every trading day. Balances refresh around 4:30pm Eastern once the market settles, and each day’s snapshot is stamped to the correct market day.
- Add new accounts without reconnecting. Opened a new account at a brokerage you’ve already linked? An "Add accounts" button pulls it in — no disconnect-and-redo, and your history stays put.
- Connect from your phone. The brokerage connection flow now works smoothly on mobile, including the hop out to your brokerage and back.
One net worth, everywhere you look
Your net worth is the number Tally is most responsible for getting right — so it now comes from a single source of truth. The figure on your Home page, in your reports, and in your quarterly email is the same figure, stamped with exactly when it was measured.
- Every surface agrees. Home, reports, and emails all draw from the same measurement, each labeled with its as-of time — no more two pages, two numbers.
- History that holds still. Past months are now frozen once they close, so the net worth you saw in March is still the net worth you see for March.
- Steadier home values. Home valuations now blend Zillow and Redfin estimates, with a guard against either source having an off day — fewer mysterious jumps in your biggest asset.
- Smarter AI across the board. The chat assistant, advisor, and auto-categorization are now running on the newest model generation.
More improvements
Upgrades that didn’t need their own headline.
Account filters are grouped by what the account is
Everywhere you pick accounts — reports, performance, filters — they’re now grouped by kind: bank accounts, brokerages, retirement, credit cards. The groups match how you actually think about your money.
Transactions in the account drawer are clickable
Spot something off while browsing an account’s recent activity? Click the transaction and the edit window opens right there — no detour through the Transactions page.
Year-End Outlook counts the month you’re in
The on-track-for-year-end check now includes the current month, so a paycheck that landed yesterday shows up in your outlook today instead of waiting for the month to close.
Your avatar shows your real initials
The little circle in the corner now shows your name’s initials instead of a generic placeholder. Small thing, nicer to look at.
Fixes
Small things that were wrong. Now they're right.
- Budget Scorecard labels its budgeted figures clearly and no longer says "No plan" when you have one.
- The chat assistant now quietly retries when the AI service is briefly busy, instead of surfacing an error.
- The "Why these results" explanation on the Simulation page opens reliably.
- An account’s balance history now begins the day the account does — no more flat line stretching back before it existed.
- A balance chart with a single reading now shows as a simple bar instead of a misleading trend line.
Go explore your forecast
Sign in, open Forecast, and click a year on the timeline — any year. See what it holds, follow the money-flow statement down, and then peek at the year you plan to retire.